
 Image: Thinkstock
When I began to work with Windows 10, I was able to shut the laptop down without Googling to find the power button icon; a great improvement over Windows 8. My next interest was determining what to do when the OS falls over, generating a Blue Screen of Death. This article will describe how to set your system up so that, when it does, you’ll be able to find the cause of most crashes in less than a minute for no cost.
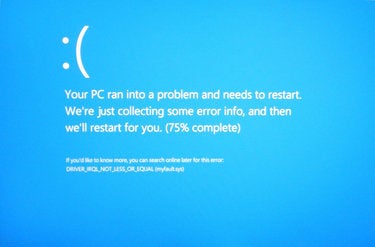
In Windows 10, the Blue Screen looks the same as in Windows 8/8.1. It’s that screen with the frown emoticon and the message “Your PC ran into a problem . . .” This screen appears more friendly than the original Blue Screens, but a truly friendly screen would tell you what caused the problem and how to fix it; something that would not be difficult since most BSODs are caused by misbehaved third party drivers that are often easily identified by the MS Windows debugger.
+ For earlier versions of the OS, refer to the following:
Windows 8: (Article) How to solve Windows 8 crashes in less than a minute (Slide show) How to solve Windows 8 crashes Windows 7: Solve Windows 7 crashes in minutes Windows XP/2000: How to solve Windows crashes in minutes
Just to be clear, this article deals with system crashes, not application crashes or system hangs. In a full system crash, the operating system has concluded that something has gone so wrong (such as memory corruption) that continued operation could cause serious or catastrophic results. Therefore, the OS attempts to shut down as cleanly as possible – saving system state information in the process – then restarts (if set to do so) as a refreshed environment and with debug information ready to be analyzed.
Why Windows 10 crashes
To be sure, Windows has grown in features and size since its introduction in 1985 and has become more stable along the way. Nevertheless, and in spite of the protection mechanisms built in to the OS, crashes still happen.
Once known as the Ring Protection Scheme, Windows 10 operates in both User Mode (Ring 3) and Kernel Mode (Ring 0). The idea is simple; run core operating system code and device drivers in Kernel Mode and software applications and user mode drivers in User Mode. For applications to access the services of the OS and the hardware, they must call upon Windows services that act as proxies. Thus, by blocking User Mode code from having direct access to Kernel Mode, OS operations are generally well protected.
The problem is when Kernel Mode code goes awry. In most cases, it is third-party drivers living in Kernel Mode that make erroneous calls, such as to non-existent memory or to overwrite OS code, that result in system failures. And, yes, it is true that Window itself is seldom at fault.
Where to get help with Windows 10 crashes
There are plenty of places to turn to for help with BSODs, a few of which are listed below. For example, ConfigSafe tells you what drivers have changed and AutorunCheck tells you what Windows Autorun settings have changed. Both help nail the culprit in a system failure. And everyone should have the book Windows Internals; it is the bible that every network admin and CIO should turn to, especially Chapter 14 “Crash Dump Analysis,” which is in Part 2 of the book.
When I asked Mark Russinovich, one of the authors, why a network admin or CIO – as opposed to a programmer – should read it, he said, “If you’re managing Windows systems and don’t know the difference between a process and a thread, how Windows manages virtual and physical memory, or how kernel-mode drivers can crash a system, you’re handicapping yourself. Understanding these concepts is critical to fully understanding crash dumps and being able to decipher their clues.”
So, while WinDbg provides the data about the state of a system when it fell over, Windows Internals turns that cryptic data into actionable information that helps you resolve the cause.
WHERE TO FIND BSOD HELP
Guide:http://pcsupport.about.com/od/fixtheproblem/ht/stoperrors.htm
Tool:http://imaginelan.net/autoruncheck-home/
Form:http://www.cnet.com/forums/windows-10/
Tool:http://imaginelan.net/configsafe-home/
Help Site:http://www.experts-exchange.com/topics/windows-10/
Tool:http://sampansecurity.com/firetowerguard.html
Forum:http://www.windows10forums.com/
Tool:https://technet.microsoft.com/en-us/sysinternals/bb963902
Tool:http://www.microsoft.com/en-us/windows/enterprise/products-and-technologies/mdop/dart.aspx
Forum:https://social.technet.microsoft.com/Forums/en-US/home?category=Windows10ITPro
Forum:http://www.tenforums.com/
Tool:http://www.resplendence.com/whocrashed
Tool:http://msdn.microsoft.com/en-us/windows/hardware/gg463009.aspx
Book:http://technet.microsoft.com/en-us/sysinternals/bb963901.aspx
Forum:http://windowssecrets.com/forums/forumdisplay.php/68-Windows-10-Forum
What is a memory dump?
A memory dump is a copy or a snapshot of the contents of a system’s memory at the point of a system crash. Dump files are important because they can show who was doing what at the point the system fell over. Dump files are, by the nature of their contents, difficult to decipher unless you know what to look for.
Windows 10 can produce five types of memory dump files, each of which are described below.
1. Automatic Memory Dump
Location:%SystemRoot%Memory.dmp Size: Size of OS kernel
The Automatic memory dump is the default option selected when you install Windows 10. It was created to support the “System Managed” page file configuration which has been updated to reduce the page file size on disk, primarily for small SSDs, but will also benefit servers with large amounts of RAM. The Automatic memory dump option produces a Kernel memory dump; the difference is when you select Automatic it allows the SMSS process to reduce the page file smaller than the size of RAM.
To check or edit the system paging file size, go to the following:
Windows 10 button | Control Panel | System and Security | System | Advanced system settings | Performance | Settings | Advanced | Change
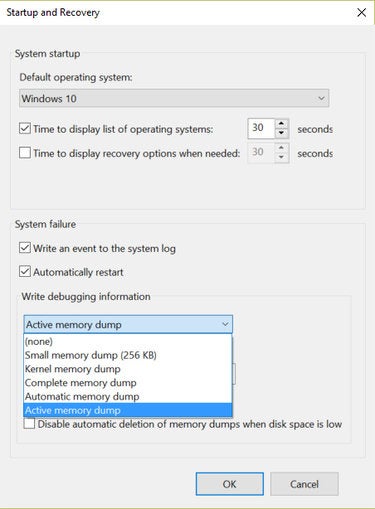
2. Active Memory Dump
Location: %SystemRoot%Memory.dmp Size: Triple the size of a kernel or automatic dump file
The Active memory dump is a recent feature from Microsoft. While much smaller than a complete memory dump, it is probably three times the size of a kernel dump. This is because it includes both the kernel and the user space. On my test system with 4GB RAM running Windows 10 on an Intel Core i7 64-bit processor the Active dump was about 1.5GB. Since, on occasion, dump files have to be transported I compressed it, which brought it down to about 500MB.
3. Complete Memory Dump
Location: %SystemRoot%Memory.dmp Size: Installed RAM plus 1MB
A complete (or full) memory dump is the largest dump file because it includes all of the physical memory that is used by the Windows OS. You can assume that the file will be about equal to the installed RAM. With many systems having multiple GBs, this can quickly become a storage issue, especially if you are having more than the occasional crash. Generally speaking, stick to the automatic dump file.
4. Kernel Memory Dump
Location: %SystemRoot%Memory.dmp Size: ≈size of physical memory “owned” by kernel-mode components
Kernel dumps are roughly equal in size to the RAM occupied by the Windows 10 kernel, about 700MB on my test system. Compression brought it down nearly 80% to 150MB. One advantage of a kernel dump is that it contains the binaries which are needed for analysis. The Automatic dump setting creates a kernel dump file by default, saving only the most recent, as well as a minidump for each event.
5. Small Memory Dump (a.k.a. a mini dump)
Location: %SystemRoot%Minidump Size: At least 64K on x86 and 128k on x64 (279K on my W10 test PC)
Minidumps include memory pages pointed to them by registers given their values at the point of the fault, as well as the stack of the faulting thread. What makes them small is that they do not contain any of the binary or executable files that were in memory at the time of the failure. However, those files are critically important for subsequent analysis by the debugger.
MORE ON WINDOWS 10: How to detect buggy device drivers in Windows 10| What causes Blue Screen of Death in Windows 10?
As long as you are debugging on the machine that created the dump file, WinDbg can find them in the System Root folders (unless the binaries were changed by a system update after the dump file was created). Alternatively, the debugger should be able to locate them automatically through SymServ, Microsoft’s online store of symbol files. Unless changed by a user, Windows 10 is normally set to create the automatic dump file for the most recent event and a minidump for every crash event, providing an historic record of all system crash events for the life of the system.
Configuring Windows 10 to generate the right memory dump
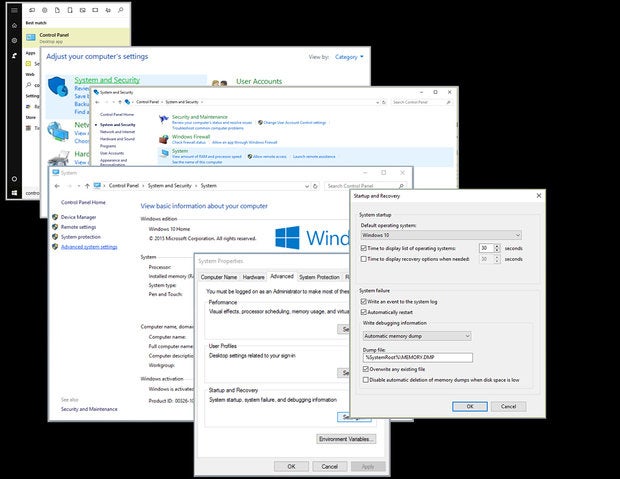
Open Control Panel and go to the Startup and Recovery window:
Windows 10 button | Control Panel | System and Security | System | Advanced system settings | Startup and Recovery | Settings | Automatic memory dump
In the final window, Startup and Recovery, select the “Automatic memory dump” option as shown below and check the “Automatically restart” box (both of which are typically set by default in Windows 10).
Install WinDbg (you may not want it but you need it)
System Requirements To setup a PC for WinDbg-based crash analysis, you will need the following:
32-bit or 64-bit Windows 10 Depending on the processor you are running the debugger on, you can use either the 32- or 64-bit debugging tools. Note that it is not important whether the dump file was made on an x86-based or an x64-based platform.WinDbg The Debugging Tools for Windows portion of the Windows SDK for Windows 10 which you can download for free from Microsoft.Hard drive space Approximately 250MB of hard disk space (not including storage space for dump files or for symbol files)Internet Live Internet connection
Download WinDbg Download sdksetup.exe from Microsoft (about 1.2MB) that will launch the installation program from which you will select what components to install. Either go to the Hardware Dev Center page at Microsoft, scroll down to “Get debugging tools” and select “Debugging Tools for Windows 10 (WinDbg)” (item “A” below) or initiate the immediate download (item “B” below).
A) Microsoft Hardware Dev Center
B) Automatic download
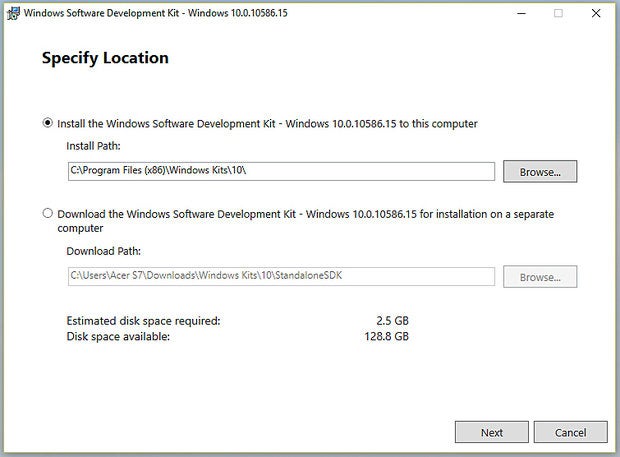
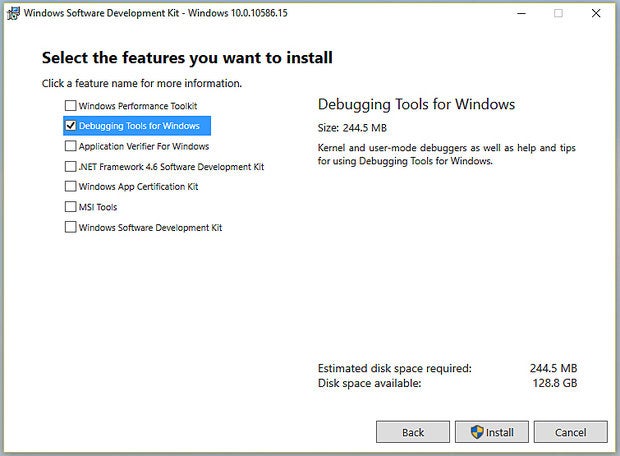
Space required Ignore the “Estimated disk space required” until you deselect the unwanted tools. Be sure to deselect all except “Debugging Tools for Windows,” which includes kernel and user-mode debuggers, plus help and tips for using the tools. Unless you will be coding, you won’t need the other modules and you will save a lot of disk space. In this test machine the install went from 2.5GB to about 250MB.
Run sdksetup.exe Install the Software Development Toolkit (SDK) on the system that you will use to analyze memory dump files on and remember that it can be a 32- or 64-bit machine running another version of Windows (it does not need to be running Windows 10).
1. Launch sdksetup.exe
2. Specify the location: The default installation path follows: C:Program Files (x86)Windows Kits10 Either accept the default or select the second option and define the path as you need.
3. Accept or reject the Windows Privacy question.
4. Accept the license Agreement.
5. Deselect all except “Debugging Tools for Windows”.
What are symbols and why you need them
With WinDbg installed – but before calling up a dump file – you need symbol table files. Symbol files for software are like exit signs on the highway; they tell you what is located if you stop there. They are a byproduct of compiling source code into an executable file (from a high-level language into machine code). During this process, the compiler creates symbol files with a list of identifiers, their locations in the program and their attributes.
INSIDER Review: Enterprise guide to Windows 10
However, programs do not need this information to execute, so symbols are typically stored in a separate file. This reduces the size of the executable resulting in the use of less disk space and faster load and operating speeds. Further, those symbol files are not normally shipped with the OS or the application they come from. The problem, then, is that when a program causes a problem resulting in a system failure, the OS only knows the hex address at which the problem occurred, but not who was there and what he was doing. Fortunately, Microsoft provides access to SymServ, which resolves the problem.
When opening a memory dump, WinDbg looks at the executable files (.exe, .dll, etc.) and extracts version information. It then creates a request to SymServ at Microsoft that includes version information and locates the precise symbol tables to draw information from. As mentioned earlier, it will not download all symbols for the specific operating system you are troubleshooting; it will download only what it needs.
In this case, for this Windows 10 PC, the symbol file folder ended up being 22MB in size. After running numerous crash tests, the folder was about 35MB. On another system upon which I ran numerous tests from several different PCs, the folder was still under 100MB. Just remember that if you open files from additional machines (with variants of the operating system) your folder can continue to grow in size.
Alternatively, you can opt to download and store the complete symbol file from Microsoft. Before you do, note that – for each symbol package – you should have at least 1GB of disk space free. This is because, in addition to space needed to store the files, you also need space for the required temporary files. Even with the low cost of hard drives these days, the space used is worth noting.
Each x86 symbol package may require 750 MB or more of hard disk space.Each x64 symbol package may require 640 MB or more.
Symbol packages are non-cumulative unless otherwise noted, so if you are using an SP2 Windows release, you will need to install the symbols for the original RTM version and for SP1 before you install the symbols for SP2.
If you want to download the symbol files and save them locally (be sure to read the system requirements before downloading).
SymServ (aka: SymSrv/Symbol Table Server) is a critically important service provided – at no cost – by Microsoft to ensure accurate memory dump analysis. To use it, simply configure WinDbg to locate it and SymServ will automatically retrieve symbols specific to the exact version of Windows that the dump came from. And, after analyzing a dump file from one machine, if you call up a dump file from another, WinDbg and SymServ will automatically retrieve the symbols for that version of the OS as well.
Configuring WinDbg
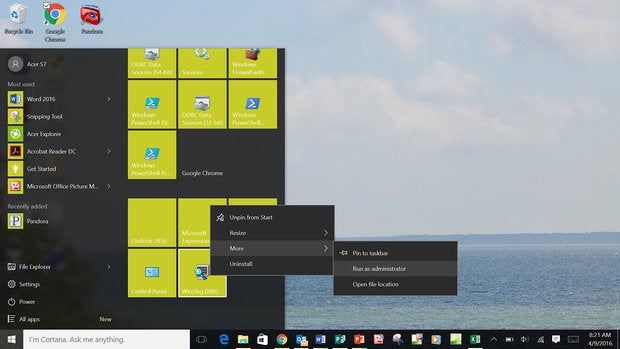
From the Windows 10 UI, select the Windows 10 button then WinDbg | More | Run as administrator
You will then see a window with a few menu options and a blank main window area. Before you open a dump file, you must tell WinDbg where to find the symbol files.
Configuring WinDbg Correlating a Windows dump file with the appropriate symbol files is not merely a matter of knowing which version number of the OS was running. There are myriad variants to the OS, a fact that is not obvious. The only way to be sure which file is correct is to let SymServ find it for you.
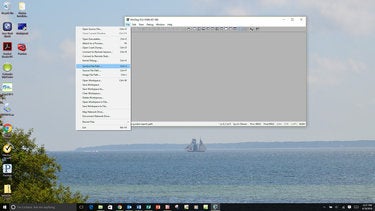
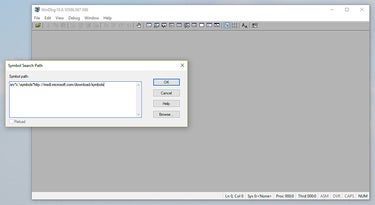
Setting the symbol file path There are a huge number of symbol table files for Windows because every build, every update, every patch and the myriad one-off variants each result in a new file. And using the wrong symbols to evaluate a dump file would be like using a map for Boston to navigate San Francisco.
Enter the following path: srv*c:cache*http://msdl.microsoft.com/download/symbols
In place of *c:cache*, be sure to insert what location you want to store symbols.
In this case, c:symbols was used. Then select OK.
Note: be sure that your firewall allows access to msdl.microsoft.com not just www.microsoft.com.
What if you don’t have a memory dump to look at? No worries. You can generate one yourself. Yes, you can cause your system to crash and do so safely. There are different ways to do it but the best way is to use a cool tool called NotMyFault created by Russinovich.
Download NotMyFault To get NotMyFault, go to the Windows Internals Book page at SysInternals and scroll down to the Book Tools section where you will see a link to download it. The tool includes a selection of options that load a misbehaving driver (which requires administrative privileges). After downloading, I created a shortcut from the desktop to simplify access.
Note that Chapter 14 (Part Two of the book) thoroughly covers the use of NotMyFault and, more importantly, crash dump analysis.
WARNING: Using NotMyFault will create a system crash and while I’ve never seen a problem using the tool, there are no guarantees in life, especially in computers. So, prepare your system and have anyone who needs access to it log off for a few minutes. Save any files that contain information that you might otherwise lose and close all applications. Properly prepared, the machine should go down, reboot and both a minidump and a kernel (or whatever size you select) dump should be created.
Opening a dump file
Locating a dump file Dump files in Windows systems are located in two places, depending upon which type you open:
All dump files except minidumps: c:WindowsMEMORY.DMPMinidumps: c:WindowsMinidump[Minidump names vary]
Note that, unlike the other dump files that are named MEMORY.DMP, minidumps are automatically individually named so that previous files are not overwritten, which is fine since they are so small.
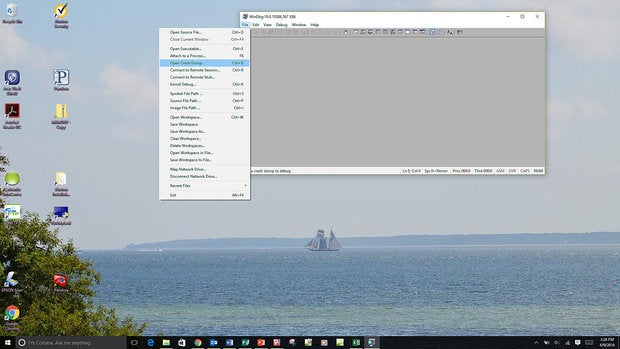
Open a dump file To open the file you’ve selected, go to
Select File | Open Crash Dump
If you see the following, STOP:
*** WARNING: Unable to verify timestamp for ntoskrnl.exe *** ERROR: Module load completed but symbols could not be loaded for ntoskrnl.exe This is important. When you see these two messages near the beginning of the output from WinDbg, it means that you will not get the analysis that you need. This is confirmed after the “Bugcheck Analysis” is automatically run, and the message below is displayed.
When you see the following message:
“*** ERROR: Symbol file could not be found. Defaulted to export symbol for ntkrnlmp.exe. . .”
It means that WinDbg did not locate the proper symbols for ntkrnlmp.exe – the Windows OS kernel itself – and that proper analysis cannot be done.
***** Kernel symbols are WRONG. Please fix symbols to do analysis
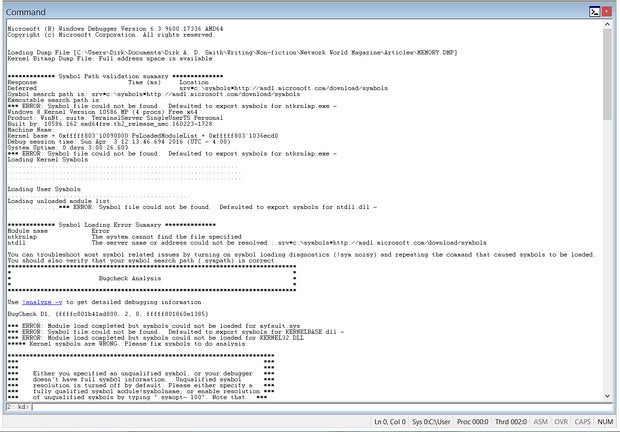
Likely causes follow:
No path/wrong path; a path to the symbol files has not been set or the path is incorrect (look for typos such as a blank white space). Check the Symbol Path (see Setting symbol file path above.)Failed connection; check your internet connection to make sure it is working properly.Access blocked; a firewall blocked access to the symbol files or the files were damaged during retrieval. See that that no firewall is blocking access to msdl.microsoft.com (it may only be allowing access to www.microsoft.com).
Note that if a firewall initially blocks WinDbg from downloading a symbol table, it can result in a corrupted file. If unblocking the firewall and attempting to download the symbol file again does not work; the file remains damaged. The quickest fix is to close WinDbg, delete the symbols folder (which you most likely set at c:symbols), and unblock the firewall. Next, reopen WinDbg and a dump file. The debugger will recreate the folder and re-download the symbols. Do not go further with your analysis until this is corrected.
ALSO ON NETWORK WORLD: What if Windows went open source tomorrow?
If you see the following error, no worries:
*** WARNING: Unable to verify timestamp for myfault.sys *** ERROR: Module load completed but symbols could not be loaded for myfault.sys
This means that the debugger was looking for information on myfault.sys. However, since it is a third-party driver there are no symbols for it because Microsoft does not store all of the third-party drivers (OK, myfault.sys is made by SysInternals, which is owned by Microsoft, but it is certainly not a regular Microsoft product and, for our purposes, it represents a third-party driver). The point is that you can ignore this error message. Vendors do not typically ship drivers with symbol files and they aren’t necessary to your work; you can pinpoint the problem driver without them.
See why Windows 10 crashed
Assuming all went well, just opening the dump file caused WinDbg to identify the OS and binaries, locate the correct symbol table file, download the needed files and run a basic analysis. If this is the first time WinDbg has been run on this system or if you are looking at a dump file from another system you have not loaded files for before, this may take a moment. In subsequent sessions, the analysis will likely be faster because most or all of the symbols needed will already be on the hard drive.
The information presented ranges from things such as the version of WinDbg, the location and name of the dump file opened, the symbol search path being used and even a brief analysis as shown below.
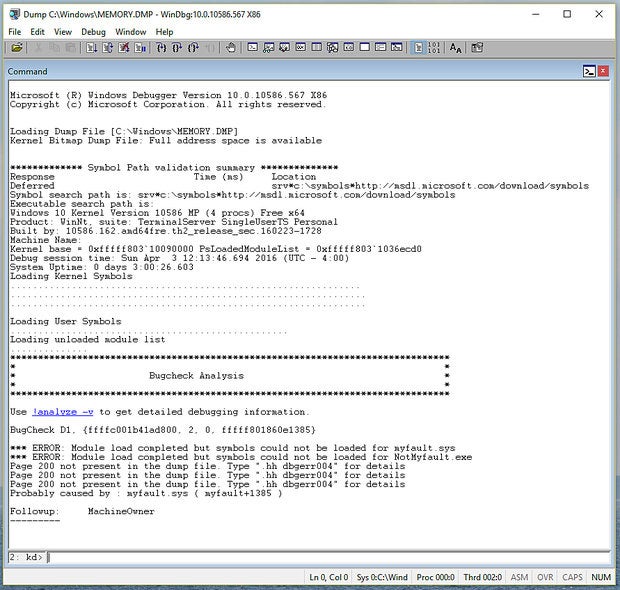
The line “Probably caused by : myfault.sys“ we know to be true in this case since it is the name of the driver for NotMyFault.
Often, when diagnosing the cause of a Windows crash, more information is needed. For instance, you might recognize the driver but you might not be certain that it is the latest release; you might not recognize the driver or know who made it; or in other cases, the driver might actually be from Microsoft and be related to the OS kernel, which makes it a very unlikely suspect. To learn more, all you will typically need are two commands:
!analyze -v and lmvm
NOTE: The first command is pronounced “bang analyze dash vee”
Commands
Analyze the crash event in verbose modeDescribe the state of the system when it crashed, the fault encountered and identify the likely culprit
Load module data in verbose modeDisplay metadata for the module named after the command
Over the years, Microsoft has continued to grow and refine WinDbg. For instance, while the two commands listed above would normally be entered in the command window at the bottom of the WinDbg screen that displays a “kd>” prompt (which stands for kernel debugger), both commands can now be initiated by selecting a hot link in the WinDbg interface.
!analyze -v The output from selecting !analyze -v provides more detail about the system crash event. In this case, the analysis accurately describes the actions of the test driver (myfault.sys) which was instructed by the test program to access an address at an interrupt level that was too high.
Output from !Analyze -v DRIVER_IRQL_NOT_LESS_OR_EQUAL (d1)
An attempt was made to access a pageable (or completely invalid) address at an interrupt request level (IRQL) that is too high. This is usually caused by drivers using improper addresses.
The BUCKET_ID_FUNC_OFFSET is the distance from the base address of the suspect module where the problematic code resides
The important points are that the suspect module named by WinDbg is myfault and that, since we know that this is a third-party driver, he is very likely guilty.
To get a better picture of what was happening when the OS fell over, look at the stack.
Walking the stack It is always important to look at the stack output displayed by the debugger because it shows who was active and what he was doing leading up to the crash. When looking at the stack, always look at the far right end of the stack for any third-party drivers and always remember that the stack is displayed in reverse chronological order. Therefore, the sequence of events goes from the bottom to the top; as each new task is performed by the system it shows up at the top, pushing the previous actions down. In this stack you can see that NotMyFault/myfault was active. Following the last activity by the driver, Windows 10 declared a PageFault then a BugCheck which stopped the system (Blue Screened).
The metaphor that I have often used in technical sessions is to relate stack walking with stepping into the room where a murder just took place and finding a body on the floor and someone standing over it with a smoking gun in his hand; it does not mean that he is guilty but it surely makes him suspect No.1.
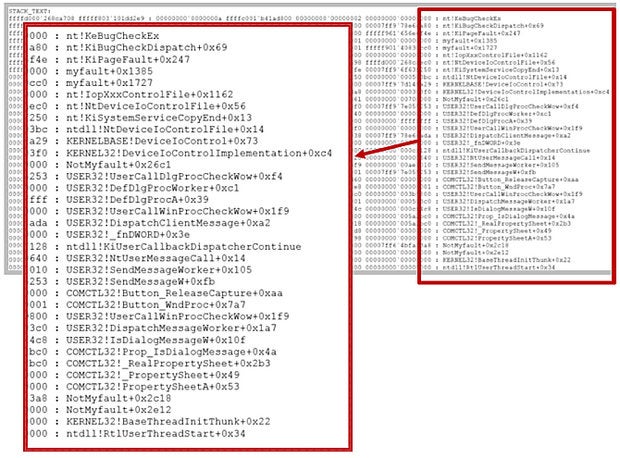
NotMyFault/ myfault was active
Assuming that we need more information about the suspect module, run lmvm.
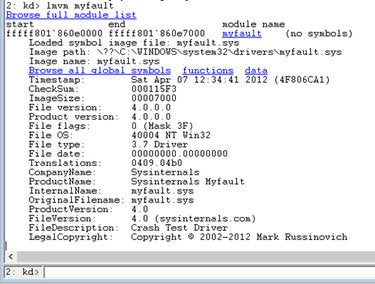
lmvm [module name] Now that we have a suspect module to consider, it is important to learn more about it. The two key reasons for this are simply to ensure that it is indeed a third-party module and to determine if it is an out of date module. lmvm tells both and more as shown in the exhibit. For instance, we can see that the maker of the module is SysInternals and that it has a timestamp of April 2012.
Granted, we know that SysInternals has been absorbed into Microsoft. However, the module is hardly a kernel OS driver, so it serves our demonstration purposes of playing the role of a third-party driver. Also, it is unlikely that a 4-year-old driver is up to date. If this were a real situation and the driver named was, for example, a video driver, there would almost certainly be a newer driver with fixes incorporated. From lmvm you would know what vendor to turn to for updated information on the driver and, likely, an updated version to install.
While most BSODs causes are easily attributed to third party drivers, some are not so clear. In these cases, the cause can be anything from an overheated system resulting from a failing case fan to faulty memory modules.
Recurring crashes that have no clear or consistent cause will often be from memory issues. Two good ways to check memory are the Windows 10 Memory Diagnostics and Memtest86.
Is Windows guilty?
Probably not. For many years, many people have been quick to blame the Windows OS for system crashes when, in fact, it rarely is. Often, when Windows code is named as the culprit, it is typically that some other driver made a request for a Windows component to perform an operation and passed a bad instruction, such as telling it to write to non-existent memory. In cases like this, the OS is often seen as the guy holding the smoking gun, but he did what he was told to do, making identification of the initiator of the request often a difficult task.
What about antivirus, backup and other utilities? It is common to see drivers like those used for antivirus or backup utilities named as the culprit. However, they might not be the bad guy. Such utilities must be active because they have to keep an eye on file change activities meaning that, regardless of what else is going on, they will often be found on the stack.
Regardless of whether you find a viable culprit named, use Google; whatever problem you are experiencing has probably been experienced by others and there are myriad places on the Internet with helpful information.
The time it takes you to read this article and to set up WinDbg will be well compensated when you find that you’ll be able to resolve most BSODs in less than a minute without help and for free. And remember that a careful study of Windows Internals will extend your new-found skills dramatically.
Dirk Smith is a freelance writer. He can be reached at [email protected].


